when to play two hands....

sagefr0g

Well-Known Member
i frequently have the following scenerio happen to me:
it's usually about one deck dealt. the running count struggles up to +8 and hovers there. but it just won't make it to +10. then the rc falls back down after a round or two.
the point is in that case i'm computing the true count is still +1 but close to +2 but just not making it to +2. then the darn rc falls and the true is even lower.
of course i'm itching to up my bet, but my bet scheme doesn't call for raising my bet from 1 unit to 2 units untill the true gets to +2.
ok so my question is would it be a good idea when this happens (ie rc=+8 at one deck dealt) to go ahead and play two hands of one unit? or would it be better if i'm wanting to get some money on the table to just add some $1 chips to my one unit bet?
sorry if the question isn't very clear. :confused:
let me add this is a six deck game fairly normal rules.

best regards,
mr fr0g :D
 
Last edited:

Cass

Well-Known Member
sagefr0g said:
i frequently have the following scenerio happen to me:
it's usually about one deck dealt. the running count struggles up to +8 and hovers there. but it just won't make it to +10. then the rc falls back down after a round or two.
the point is in that case i'm computing the true count is still +1 but close to +2 but just not making it to +2. then the darn rc falls and the true is even lower.
of course i'm itching to up my bet, but my bet scheme doesn't call for raising my bet from 1 unit to 2 units untill the true gets to +2.
ok so my question is would it be a good idea when this happens (ie rc=+8 at one deck dealt) to go ahead and play two hands of one unit? or would it be better if i'm wanting to get some money on the table to just add some $1 chips to my one unit bet?
sorry if the question isn't very clear. :confused:
let me add this is a six deck game fairly normal rules.

best regards,
mr fr0g :D
I'm betting 2 or three units usually at a tc of +1
 

Sonny

Well-Known Member
It all depends on if your betting strategy was calculated using rounded TCs or truncated TCs. It sounds like you normall truncate the TC (a TC of +1.8 gets rounded down to +1 instead of up to +2). If that is how your betting strategy is set up then you should not raise your bet until you reach the next TC. You would not raise your bet when the TC moves from +1 to +1.5. The advantage at a TC of +1 has been calculated to include every TC from +1.0000 to +1.99999. To raise your bet at +1.5 (or anything between +1 and +2) would result in a slight overbet. Any small increase in advantage at a TC of +1.5 has already been added to your TC of +1 so you will "double count" it if you raise your bet.

Also, the advantage at various TCs does not raise linerarly. If a TC of +2 has an advantage of 1% and a TC of +4 has an advantage of 3% (hypothetically) that doesn't mean that a TC of +3 has an advantage of 2%. The advantage does not raise in steady increments because of uneven distributions of certain plays, like doubles. Also, the advantage may raise steeply at certain TCs because of indices (especially insurance).

In general it is best to wait until you get the full TC to raise your bet. Don't be too hasty to put out big bets when the count is not strong enough. I know it can be hard in those sloooooow shoe games. :D

-Sonny-
 

sagefr0g

Well-Known Member
Sonny said:
It all depends on if your betting strategy was calculated using rounded TCs or truncated TCs. It sounds like you normall truncate the TC (a TC of +1.8 gets rounded down to +1 instead of up to +2). If that is how your betting strategy is set up then you should not raise your bet until you reach the next TC. You would not raise your bet when the TC moves from +1 to +1.5. The advantage at a TC of +1 has been calculated to include every TC from +1.0000 to +1.99999. To raise your bet at +1.5 (or anything between +1 and +2) would result in a slight overbet. Any small increase in advantage at a TC of +1.5 has already been added to your TC of +1 so you will "double count" it if you raise your bet.

Also, the advantage at various TCs does not raise linerarly. If a TC of +2 has an advantage of 1% and a TC of +4 has an advantage of 3% (hypothetically) that doesn't mean that a TC of +3 has an advantage of 2%. The advantage does not raise in steady increments because of uneven distributions of certain plays, like doubles. Also, the advantage may raise steeply at certain TCs because of indices (especially insurance).

In general it is best to wait until you get the full TC to raise your bet. Don't be too hasty to put out big bets when the count is not strong enough. I know it can be hard in those sloooooow shoe games. :D

-Sonny-
ok got it and thank you.
another thing.... well i didn't really calculate my betting strategy by the true count. i just modeled it after what i read in the literature and revised it by advice recieved.
so if i was to try and calculate a betting ramp by the true count how does one go about that. i suppose you first need to figure what max bet you can afford according to your bankroll and according to what ROR you are comfortable with. then i suppose you run a simulation to determine the percent advantage you have for the game in question at a given true count. from there you ramp up the bets according to the advantage per tc ?

best regards,
mr fr0g :D
 

Sonny

Well-Known Member
sagefr0g said:
so if i was to try and calculate a betting ramp by the true count how does one go about that. i suppose you first need to figure what max bet you can afford according to your bankroll and according to what ROR you are comfortable with. then i suppose you run a simulation to determine the percent advantage you have for the game in question at a given true count. from there you ramp up the bets according to the advantage per tc ?
You got it, except you would run the simulation to get your advantages first then adjust your bets to any ROR you like. I use a spreadsheet for this. I can type in my advantage at each TC and it will calculate each optimal bet based on my bankroll. I can then experiment by typing in different sized bets at different TCs to fine-tune things a bit. The optimal Kelly bet gives a ROR of 13.5% which I don’t like. I’ll scale things down a bit and adjust the ramp so that it’s easy to parlay.

I like the spreadsheet because it instantly gives me my EV, SD, ROR, N0, and probability of being ahead after X hours without having to run a separate sim for each bet ramp. That way I can “tinker” to my heart’s content. :D

-Sonny-
 

Sonny

Well-Known Member
Due to the overwhelming response (actually, there were only two…but I’m easily overwhelmed!:D) I have decided to upload my spreadsheet. It’s really just an expanded version of Table 2.1 in Blackjack Attack. The results should be pretty accurate estimations, but once you find a good bet spread you should run a sim just to double-check the results. Here is brief description:

The BR (dollars and units) and Unit (dollars) are self explanatory. Just enter your current bankroll and unit size (both in dollars).

The EV column is the advantage at each TC. The ones on the spreadsheet are pretty generic so you might want to enter your own custom ones from a simulator.

The Freq column is the frequency of each TC. These are also from a generic simulation. Feel free to change them if you want.

The Var column is the variance for one hand of BJ. It is usually around 1.33-1.36 so you probably won’t have to change it, but you can if you want.

The Bet column is the amount you want to bet at each TC. This is where you will be experimenting with different bet sizes and spreads. You can enter a bet of zero at any TC you plan to Wong out of.

The BU^2 column is the Betting Unit Squared formula. This is used for calculating your variance and SD.

The h column is the number of hands you want to play. If you want to play 2 hands of $50 each, just enter $50 in the Bet column and 2 in the h column.

Next is the Var+(h-1)*Cov column. This one looks really confusing but is actually quite boring. It is the Variance Per Round formula. You will see that it is equal to the Var column until you play multiple hands. As soon as you spread to two hands this column will calculate the covariance and add it to the original variance for that round of play. Playing multiple hands is much less risky than playing a single hand so you will notice that the variance increases slowly as you add more hands. This column is used to calculate your final SD statistics.

The prod column is just the product of the individual variance, frequency, BU^2 and number of hands. This will sum to your total variance. This is even more boring than the last column.

The next EV column is so boring I won’t even mention it.:p

Now we get to a very exciting column - The OW formula. This calculates your Optimal Wager based on your bankroll, advantage and per-round variance. This will be the Full Kelly wager. I usually start around half-Kelly, then slowly build up the bets until I have a good compromise between EV, ROR and simplicity (ability to parlay bets without looking conspicuous). You will also notice that the OW will change if you spread to two hands. In this case the OW column will calculate the optimal wager for each hand (your total wager would be OW * h). This will allow you to get more money on the table with the same amount of risk.

The results of the spreadsheet will all appear at the bottom in pretty pastel colors. It will show you the Hands Per Hour (it usually assumes 100 unless you are Wonging, in which case it tallies up the frequencies of your bets to calculate it), your Per-Hand SD (units and dollars), your Hourly SD (units, dollars) and your Hourly EV (same deal).

The next two rows are additions that I made. I’ve included some information on your ROR. The first number is your standard lifetime ROR. The one to the right of it is your lifetime ROR if you plan to cut back to half of your bets if you lose half of your bankroll. You will find that starting out with a large ROR at first is fairly safe as long as you plan to cut back if you start to blow it. A 15% ROR suddenly becomes under 6% if you plan to cut back later on (if necessary). Since there is only about a 1/3 chance that you will lose half of your bankroll in the first place, this may be something to consider.

The ROR Odds row calculates your odds of going broke based on the ROR above it. If the ROR Odds box has a 15 in it, that means you have a 1-in-15 chance of losing your entire bankroll. It gives a little more meaning to the ROR figures.

Anyway, enjoy it. Let me know if you run into any problems or have any questions.

-Sonny-
 

Attachments

Last edited:

sagefr0g

Well-Known Member
Sonny said:
Due to the overwhelming response (actually, there were only two…but I’m easily overwhelmed!:D) I have decided to upload my spreadsheet.
-Sonny-
too kewl! :1st:

very best regards,
mr fr0g :D
 

shogun

Member
Many thanks Sonny! I was going to do something like your spreadsheet soon, but now I won't have to. I think it's time for me to break down and get a simulation program.
 

sagefr0g

Well-Known Member
question about your spread sheet....

Sonny said:
Due to the overwhelming response (actually, there were only two…but I’m easily overwhelmed!:D) I have decided to upload my spreadsheet. It’s really just an expanded version of Table 2.1 in Blackjack Attack. The results should be pretty accurate estimations, but once you find a good bet spread you should run a sim just to double-check the results. Here is brief description:

The BR (dollars and units) and Unit (dollars) are self explanatory. Just enter your current bankroll and unit size (both in dollars).

The EV column is the advantage at each TC. The ones on the spreadsheet are pretty generic so you might want to enter your own custom ones from a simulator.

The Freq column is the frequency of each TC. These are also from a generic simulation. Feel free to change them if you want.

The Var column is the variance for one hand of BJ. It is usually around 1.33-1.36 so you probably won’t have to change it, but you can if you want.

The Bet column is the amount you want to bet at each TC. This is where you will be experimenting with different bet sizes and spreads. You can enter a bet of zero at any TC you plan to Wong out of.

The BU^2 column is the Betting Unit Squared formula. This is used for calculating your variance and SD.

The h column is the number of hands you want to play. If you want to play 2 hands of $50 each, just enter $50 in the Bet column and 2 in the h column.

Next is the Var+(h-1)*Cov column. This one looks really confusing but is actually quite boring. It is the Variance Per Round formula. You will see that it is equal to the Var column until you play multiple hands. As soon as you spread to two hands this column will calculate the covariance and add it to the original variance for that round of play. Playing multiple hands is much less risky than playing a single hand so you will notice that the variance increases slowly as you add more hands. This column is used to calculate your final SD statistics.

The prod column is just the product of the individual variance, frequency, BU^2 and number of hands. This will sum to your total variance. This is even more boring than the last column.

The next EV column is so boring I won’t even mention it.:p

Now we get to a very exciting column - The OW formula. This calculates your Optimal Wager based on your bankroll, advantage and per-round variance. This will be the Full Kelly wager. I usually start around half-Kelly, then slowly build up the bets until I have a good compromise between EV, ROR and simplicity (ability to parlay bets without looking conspicuous). You will also notice that the OW will change if you spread to two hands. In this case the OW column will calculate the optimal wager for each hand (your total wager would be OW * h). This will allow you to get more money on the table with the same amount of risk.

The results of the spreadsheet will all appear at the bottom in pretty pastel colors. It will show you the Hands Per Hour (it usually assumes 100 unless you are Wonging, in which case it tallies up the frequencies of your bets to calculate it), your Per-Hand SD (units and dollars), your Hourly SD (units, dollars) and your Hourly EV (same deal).

The next two rows are additions that I made. I’ve included some information on your ROR. The first number is your standard lifetime ROR. The one to the right of it is your lifetime ROR if you plan to cut back to half of your bets if you lose half of your bankroll. You will find that starting out with a large ROR at first is fairly safe as long as you plan to cut back if you start to blow it. A 15% ROR suddenly becomes under 6% if you plan to cut back later on (if necessary). Since there is only about a 1/3 chance that you will lose half of your bankroll in the first place, this may be something to consider.

The ROR Odds row calculates your odds of going broke based on the ROR above it. If the ROR Odds box has a 15 in it, that means you have a 1-in-15 chance of losing your entire bankroll. It gives a little more meaning to the ROR figures.

Anyway, enjoy it. Let me know if you run into any problems or have any questions.

-Sonny-
Sonny i'm curious to know why cell b15 in the EV column has the formula
SUM(B8:B14)/7 . i mean i wonder why it doesn't sum as follows
SUM(B5:B14)/10 ? that would give you the average EV in cell b15 right.... i guess what i'm asking is what is the significance of the value derived in cell b15 ?


best regards,
mr fr0g :D
 
Last edited:

sagefr0g

Well-Known Member
another question related to spread sheet...

Quote:
Originally Posted by sagefr0g View Post
so if i was to try and calculate a betting ramp by the true count how does one go about that. i suppose you first need to figure what max bet you can afford according to your bankroll and according to what ROR you are comfortable with. then i suppose you run a simulation to determine the percent advantage you have for the game in question at a given true count. from there you ramp up the bets according to the advantage per tc ?

Sonny said:
You got it, except you would run the simulation to get your advantages first then adjust your bets to any ROR you like. I use a spreadsheet for this. I can type in my advantage at each TC and it will calculate each optimal bet based on my bankroll. I can then experiment by typing in different sized bets at different TCs to fine-tune things a bit. The optimal Kelly bet gives a ROR of 13.5% which I don’t like. I’ll scale things down a bit and adjust the ramp so that it’s easy to parlay.

I like the spreadsheet because it instantly gives me my EV, SD, ROR, N0, and probability of being ahead after X hours without having to run a separate sim for each bet ramp. That way I can “tinker” to my heart’s content. :D

-Sonny-
Sonny if you get a chance please check the images below of my sim results and how i tryed to correlate those results to your spread sheet.
i entered the EV's for a given TC from my simulation and the Frequency for a given TC . the EV percent i arrived at for TC >= 8 seem a bit large. i computed the Frequency from my sim by taking the number of hands played at a given TC and dividing by the total number of hands played then multiplying by 100%.
my bet scheme for the simulation was as follows:
tc = -1 wong out
tc <=0 1u
tc <=1 1u
tc =2 2u
tc =3 4u
tc =4 6u
tc >=5 8u
u = $5
6deck s17 das nrsa lsr 78cards behind cut card
used I18 and fab 4

mysim.jpg

spreadsheet.jpg

do you think i did this right?

best regards,
mr fr0g :D
 
Last edited:

hopson77

Well-Known Member
Many thanks for the spreadsheet!

For the purposes of this spreadsheet, does LS cancel out the effects of H17 in the 6D game?
 
Last edited:

sagefr0g

Well-Known Member
hopson77 said:
Many thanks for the spreadsheet!

For the purposes of this spreadsheet, does LS cancel out the effects of H17 in the 6D game?
not quite H17 is about -0.19 and lsr gains about 0.07 for shoe games. but if you use the fab 4 that surrender gain may get the two close to cancelling.

best regards,
mr fr0g :D
 

Sonny

Well-Known Member
sagefr0g said:
Sonny i'm curious to know why cell b15 in the EV column has the formula
SUM(B8:B14)/7 . i mean i wonder why it doesn't sum as follows
SUM(B5:B14)/10 ? that would give you the average EV in cell b15 right.
Good catch! Yup, cell b15 should be SUM(B5:B14)/10. Or you could replace it with AVERAGE(B5:B14) instead. That was a last-minute update I made for this rollout of the spreadsheet. The version I use only has rows for TC <= -2 to TC >=+5. Luckily it won’t affect any of the results. That cell doesn’t actually “do” anything in the spreadsheet, it’s just for reference.

For your results, I think you may have skipped over one of your rows in the Freq column. The Freq for TC = 0 is correct but I think the TC = +1 Freq should be 30.23% with the rest of the Freqs slid up one row. That should increase all of your positive counts and show you a greater advantage.

-Sonny-
 
Last edited:

sagefr0g

Well-Known Member
Sonny said:
..........
For your results, I think you may have skipped over one of your rows in the Freq column. The Freq for TC = 0 is correct but I think the TC = +1 Freq should be 30.23% with the rest of the Freqs slid up one row. That should increase all of your positive counts and show you a greater advantage.

-Sonny-
got it thank you much. oh yea i also had to make the frequency for TC >=8 to be 0.85% .
but anyway one more question.
is there a way to relate the overall percent advantage that my simulator come up with to your spread sheet?
my simulator gives me circa 1.1% overall advantage. how can i relate that figure to your spread sheet? i guess this is kind of a nebulous question.

best regards,
mr fr0g :D
 

jee_pack

Well-Known Member
Nice spreadsheat, I'd like to be able to use it without a simulator though. HAHA! I just don't understand why I should speed 100$ to run a simulation that gives me #'s that I will then never change? I mean, I see from Safefr0g's TC statistics that the advantages truely don't evolve in a linear fashion. But what influences these #'s? I mean, can't mathematics do all this? Without simulations? Or is it just these #s that you can't get with math? What about if you guys just shared your #s? If everyone ran simulations of an 8 deckgame with no special rules of any kind, just DAS, S17, peaks on ACE, BJ 3:2, no repsplitting of Ace's or drawing to split aces and split to 3 hands max.... wouldn't everyone get the same edge at each TC, and then we could just use these #'s to find our optimal bet and move on?? Sorry if I sound cheap or anything, it's just that I like to keep things simple. I'd like to just run a bunch of #'s find my optimal betting ramp and stick with it for a few years... See what happens... I just know for a fact that if I buy a simulator a 100$, I'll use it for a week and I'll never use it again after....
 

QFIT

Well-Known Member
jee_pack said:
Nice spreadsheat, I'd like to be able to use it without a simulator though. HAHA! I just don't understand why I should speed 100$ to run a simulation that gives me #'s that I will then never change? ....
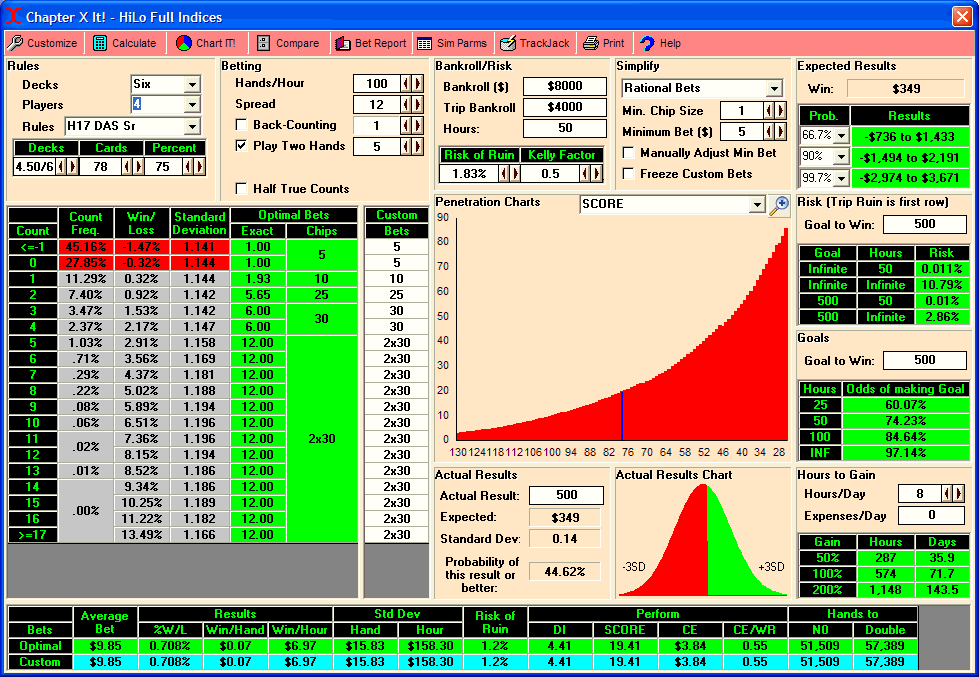
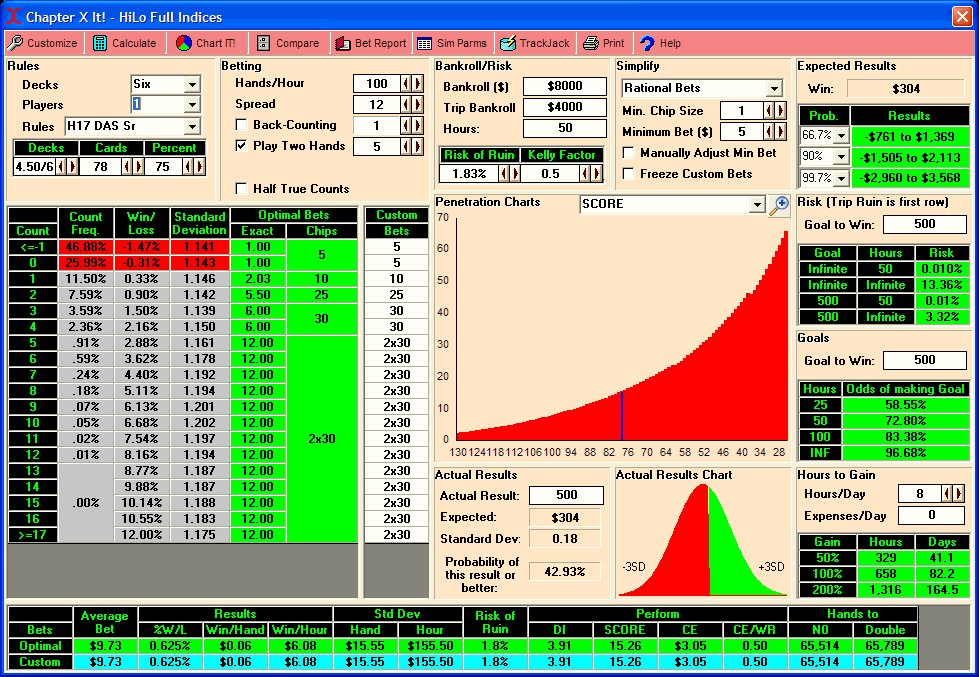
The problem is that any change in any of many variables can make a significant difference. Below are two views of the game in Sonny's post using .5 Kelly. The only difference between the two views is I changed the number of players spinner from 4 to 1. This has a significant effect when you bet one hand at some counts and two at other counts.


All I did between these two screenshots is change the players at the table spinner from 4 to 1. This caused the SCORE to drop by 21%. N0 increased by 27%. Nearly all other numbers changed. These are major differences. Yes you can run the sims and keep the results. There are 250,000 2,000,000,000 round sims behind this calculator and I'm still running more. But even that is not enough since everyone plays differently and even a couple of cards penetration changes all the numbers.
 
Last edited:

matt21

Well-Known Member
Sonny said:
Due to the overwhelming response (actually, there were only two…but I’m easily overwhelmed!:D) I have decided to upload my spreadsheet. It’s really just an expanded version of Table 2.1 in Blackjack Attack. The results should be pretty accurate estimations, but once you find a good bet spread you should run a sim just to double-check the results. -Sonny-
I just spent time looking at your file. It's very insightful.

What is amazing is to see the increase in EV without an adverse change in ROR, simply by playing multiple hands rather than just one. In my playing conditions spreading out to 2 or sometimes 3 hands should not be difficult.

Question on interpreting the standard deviation -
Let's say your file gives the following results:
EV per hour = $17.42
SD per hour = $283.95

Now casting my mind back to my University statistics course, does this mean that i should expect 68% of my 1 hour sessions to be within (-$266.52,+301.37) and 95% of my 1 hour sessions to be within (-$550.48,+$585.32)?
 

Sonny

Well-Known Member
matt21 said:
Now casting my mind back to my University statistics course, does this mean that i should expect 68% of my 1 hour sessions to be within (-$266.52,+301.37) and 95% of my 1 hour sessions to be within (-$550.48,+$585.32)?
Exactly. :)

-Sonny-
 
Top