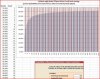
well, ok the graph came from running QFIT's calculator '
probability of reaching a goal given a time constraint' for the game and method of playing titled on the graph.
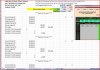
then i ran a sim of that game using sageblackjack for a player just trying to make one unit. so the sim was ran in such a way so as once the player made one unit the data was collected and the sim was restarted. did this about for about 3,000 trials, which was about 71,317 rounds.
then i put the data in excel as depicted in the image below. calculated the number and percentage of successful trials making one unit and the number of unsuccessful trials trying to make one unit.
like for those sims it was like you had 25 units and was trying to get to 26 units. different number of units than 12 to 13 units, but i think the principle is the same.
right, it's just to me interesting how the slope of that graph changes as you approach thirty hands or so and then it flattens out after about fifty hands or so. that's some sort of rate change relative to probability of success vs hands played. that rate of probability of success seems to increase at a dramatic rate for the first thirty hands or so.
i dunno for some reason that catch's my attention.

:whip:
kind of the voodoo way i interpret that, is well if your trying to make just one unit flat betting with just basic strategy and you don't succeed by fifty hands or so, well maybe you might want to try something else as far as methodology.
:whip:
lol, probably i'm confused more than vague.
just, those trials i ran in the image below, as i remember from looking at the data, well, ok first off, yeah circa 95% of the time you succeed in make one unit, but circa 5% of the time you never made one unit and in fact lost your starting bankroll. so if 159 times out of 3000 you lost your starting roll you lost $159,000 but only gained circa $40 2,841 times or $113,640. so overall you end up losing circa $45,360 . (note: i'm here, just ignoring the fact that at times trying to make just one unit, one might have made two or more units)
i mean, well, those numbers are probably off by a lot, because i'm just sort of estimating how it goes from the image below, but it's pretty much what the sim and trials showed in general.
what ever, i also think i tried to look at that data and see what would happen if you just limited each session attempt for making a unit a thirty hand attempt and then quit, then try again, sort of thing. i don't think i simmed that sort of thing specifically but just tried to 'fool' with the data and guesstimate what would happen, lol.
but anyway, the thing is, yeah the more your willing to play the probability of making the unit increases, but to me so does the chance of hitting those big losing streaks.
:whip:
that's where i wonder about that slope of the graph and the apparent rate of change of increase in probability of achieving one unit around the thirty hand point. i mean i wonder if that has any significance as far as what the wise number of x hands might be if one is trying to make just one unit, sort of thing.
i mean, the way it looks to me, for a session where your trying to make just one unit, that ok, the first thirty hands or so should represent going through a phase where your probability of success rises dramatically as you continue to play hands, but then after about fifty hands or so your in a phase where yeah, your probability of success is relatively high but it doesn't increase as dramatically the more you play.
:whip: