The Great Debate, With Meaning

aslan

Well-Known Member
blackjack avenger said:
You walk by a 6 deck shoe half dealt and on the table is RC 12

Option 1
RC 12 TC 2 with 6 decks unseen

Option 2
You are assuming those 12 high cards are split between the cards before the hand you have seen and half are in the cards yet to be played.
RC 6 TC 2 with 3 decks unplayed

Option 2 would have very high variance; mostly due to the low divisor?, but it could be done.

So let's try to lower the variance with another example.

6 deck shoe
Your partner misses the first deck and informs you.
Your partner also informs you the rc is 10 with 1 deck to go.
1 deck to go rc 10

Option 1
rc 10
2 decks unseen
tc 5

Option 2
Since you know the 10 good cards are split between the first deck missed and the deck yet to be played. You can make an assumption about the remaining deck.
rc 5
1 deck to go
tc 5

The variance of the second example would be less then the first example because you have knowledge of more cards and are making assumptions on fewer cards.

In all situations above your expectation is positive. Also, in the real world where many use level I counts, perhaps unbalanced counts, grouped indices, negative expectation bets, camo betting, non perfect TC conversions, combined BS and the effect of the float being off a few cards in one's assumptions in both option 2's is NOT going to break you! Whenever we play we can miss the good cards.

:joker::whip:
This should be good
A randomly shuffled shoe does not mean that any card group will usually be evenly distributed between two halves. Even distributions are consistently observable in very large numbers on a percentage basis, but thankfully not in small ones, otherwise card counting would be pretty much useless. At least, that's the way I see it.
 

blackjack avenger

Well-Known Member
Zero Not My Hero

aslan said:
A randomly shuffled shoe does not mean that any card group will usually be evenly distributed between two halves. Even distributions are consistently observable in very large numbers on a percentage basis, but thankfully not in small ones, otherwise card counting would be pretty much useless. At least, that's the way I see it.
If I follow you, I agree. What are the most common RCs and TCs? The ones closest to zero. The variance of the RCs and TCs away from zero is what allows us to play.
 

aslan

Well-Known Member
blackjack avenger said:
If I follow you, I agree. What are the most common RCs and TCs? The ones closest to zero. The variance of the RCs and TCs away from zero is what allows us to play.
Right. One might think that in a randomly shuffled deck, every other card would be a high card (7 - K), but that is simply not true. A randomly shuffled deck is all over the place. A randomly shuffled deck means that all of the possibilities of arranging the cards has an equal chance of being. Recently, they discovered that seven shuffles ensures approximately a randomly shuffled deck. But cards clump and no matter how many times you shuffle them, they do not tend to being evenly distributed between high and low cards, red and black. I am guessing that the chances of clumping is inversely proportional to the chances for even distribution between, say, red and black cards. Therefore, with good pen, we should expect to see many more short positive counts than long positive counts. That is consistent with my experience. Of course, complicating matters is the fact that casino shuffles are not random, if you accept the finding that it takes seven shuffles to approximate a random shuffle. (These are all my own thoughts and not mathematically determined, at least, not by me.)
 

Gamblor

Well-Known Member
I personally usually stick with option 1, simply because its easier :)

But I would still contend that option 2 is viable. As mentioned, empirical results (i.e., actual live gameplay) is nicely modeled by option 2.

For example, lets say very early in the shoe, after 1 deck of play, the RC is extremely high, e.g., +20. At this point what do we expect from experience? Invariably we would expect this RC to go down (gravitate towards 0, and I'm not necessarily saying going to 0) as we continue further into the shoe. Sure, it might go up for a while, then go down, or go down below a 0 count, and shoot back up, or gradually go down to +10 etc., but typically we expect, and it does go down.

We would not expect the RC to hover around +20 or trend upwards, and it rarely would. The few times this has happened to me, I'm usually taken aback, the deck seems out of whack, and I suspect I might have lost the count (and probably have).

I think Option 2 models this well, which states RC will on average go down further into the shoe.
 

aslan

Well-Known Member
Gamblor said:
I personally usually stick with option 1, simply because its easier :)

But I would still contend that option 2 is viable. As mentioned, empirical results (i.e., actual live gameplay) is nicely modeled by option 2.

For example, lets say very early in the shoe, after 1 deck of play, the RC is extremely high, e.g., +20. At this point what do we expect from experience? Invariably we would expect this RC to go down (gravitate towards 0, and I'm not necessarily saying going to 0) as we continue further into the shoe. Sure, it might go up for a while, then go down, or go down below a 0 count, and shoot back up, or gradually go down to +10 etc., but typically we expect, and it does go down.

We would not expect the RC to hover around +20 or trend upwards, and it rarely would. The few times this has happened to me, I'm usually taken aback, the deck seems out of whack, and I suspect I might have lost the count (and probably have).

I think Option 2 models this well, which states RC will on average go down further into the shoe.
Sorry I can't buy it. The fact is, the shoe has just as much chance of being down in the first 3 decks as it has in the last 3 decks. If the first three decks happened to be very low, then we could expect that the last three would tend to move up, not down. We do know from the fact that we are witnessing a large number of low cards on the table, that chances are greater for there being a large number of high cards clumped somewhere else due to the simple fact that 12 more high cards than low cards exist somewhere in the unseen cards, only we don't know where, front, back, or ratably throughout.
 

blackjack avenger

Well-Known Member
Appears to Not be the Case

Gamblor said:
I personally usually stick with option 1, simply because its easier :)

But I would still contend that option 2 is viable. As mentioned, empirical results (i.e., actual live gameplay) is nicely modeled by option 2.

For example, lets say very early in the shoe, after 1 deck of play, the RC is extremely high, e.g., +20. At this point what do we expect from experience? Invariably we would expect this RC to go down (gravitate towards 0, and I'm not necessarily saying going to 0) as we continue further into the shoe. Sure, it might go up for a while, then go down, or go down below a 0 count, and shoot back up, or gradually go down to +10 etc., but typically we expect, and it does go down.

We would not expect the RC to hover around +20 or trend upwards, and it rarely would. The few times this has happened to me, I'm usually taken aback, the deck seems out of whack, and I suspect I might have lost the count (and probably have).

I think Option 2 models this well, which states RC will on average go down further into the shoe.
It appears option 1 is correct. Look at Icountintracks second group of sims.

Yes, we expect an average, but the great majority of time we are off it appears to be very bad.

Now, one thing not simmed was if you assume your average and then flat bet the remaining part of the shoe, this should work. Remove the divisor.

I thought of an explanation for the problem of option 2 this way:
You make your assumption. If small cards come out, it's an indication you are incorrect but you are raising bets. If 10s come out it's an indication you are correct but you are cutting bets.

If the cards were perfectly distritubed then you could assume, but they are not.
 

k_c

Well-Known Member
blackjack avenger said:
It appears option 1 is correct. Look at Icountintracks second group of sims.

Yes, we expect an average, but the great majority of time we are off it appears to be very bad.

Now, one thing not simmed was if you assume your average and then flat bet the remaining part of the shoe, this should work. Remove the divisor.

I thought of an explanation for the problem of option 2 this way:
You make your assumption. If small cards come out, it's an indication you are incorrect but you are raising bets. If 10s come out it's an indication you are correct but you are cutting bets.

If the cards were perfectly distritubed then you could assume, but they are not.
If it is insisted that average running count must be some value decided by some external means upon resuming play after missing a number of unseen cards then, yes you will be able to play correctly at this new pen. However, the unseen cards are actually random and can consist of any possible count.

What you have been saying is that if the unseen cards are stacked according to your criteria then you have additional information. However, the missed cards are in reality random and you know no more than what was originally known. This is the mistake.

As long as random distribution is assumed, the second method is clearly wrong.
 

Gamblor

Well-Known Member
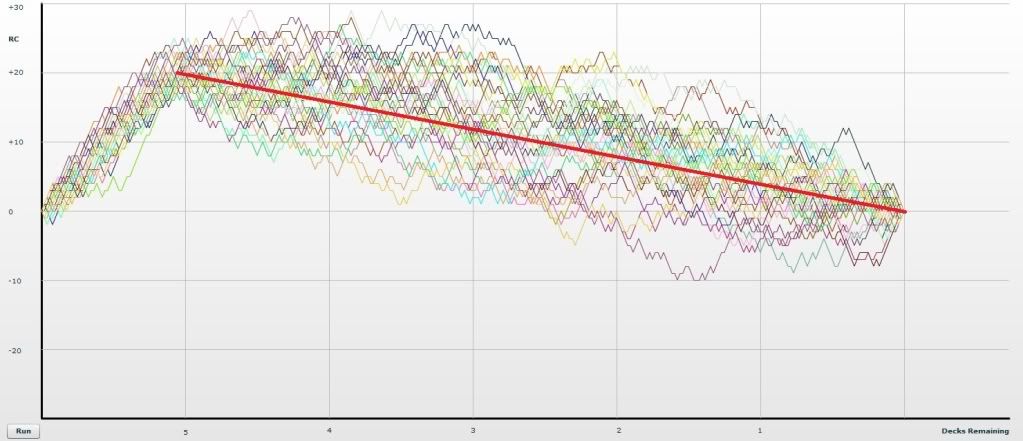
For what its worth, here's a chart that might help put some light on this discussion.

Each colored line represents a 6 decked shoe (40 shoes in all), and the RC as the deck is dealt.
1) Each shoe represents a shoe where the RC was high early on, namely +20 RC before the 1st deck was completely dealt.
2) The bold red line approximates the TC.

I personally think it lends credence to that option 2 is valid, as on average the RC goes down centering around the TC.

Bear with the bluriness of the image (couldn't upload it full size).


blackjack avenger

Well-Known Member
Gamblor

Your graph does seem to make option 2 more possible. I think someone else needs to run IcountnTracks 2nd batch of examples to see if they get similar results.

Again, I think the potential problem with option 2 is this:
When you bet moving forward if small cards come out, that is an indication your assumption may be off, yet you are raising bets.
or
When you bet moving forward if big cards come out, that is an indication your assumption may be on, yet you are lowering bets.

The lower divisor magnifies the above potential errors, overbetting is more costly then underbetting.

When you combine the 2 errors above it may get very bad.

In short, its the variance of the assumption that hurts you.

However, we face variance whenever we bet, the good cards may not come out.
 

blackjack avenger

Well-Known Member
Stretching?

k_c said:
If it is insisted that average running count must be some value decided by some external means upon resuming play after missing a number of unseen cards then, yes you will be able to play correctly at this new pen. However, the unseen cards are actually random and can consist of any possible count.

What you have been saying is that if the unseen cards are stacked according to your criteria then you have additional information. However, the missed cards are in reality random and you know no more than what was originally known. This is the mistake.

As long as random distribution is assumed, the second method is clearly wrong.
Taking what you state can one infer the below is not possible?

A game with positive expectation off the top:
One round
shuffle

I think we would agree the game is playable, yet the cards you would get are random?

If we put in the deck one joker that is an automatic win for the player; not the dealer, the game is more playable even though that joker is random

So
when you return on option 2, yes the cards are random. However the ratio of high to low cards throughout what you missed and what you will play are positive expectation.

The killer is the variace of the missed cards and the divisor.
 

MangoJ

Well-Known Member
As I read the graph the red line is the average RC.

Would you mind making a plot from the same data, but with TC ?
 

Gamblor

Well-Known Member
blackjack avenger said:
Your graph does seem to make option 2 more possible. I think someone else needs to run IcountnTracks 2nd batch of examples to see if they get similar results.

Again, I think the potential problem with option 2 is this:
When you bet moving forward if small cards come out, that is an indication your assumption may be off, yet you are raising bets.
or
When you bet moving forward if big cards come out, that is an indication your assumption may be on, yet you are lowering bets.

The lower divisor magnifies the above potential errors, overbetting is more costly then underbetting.

When you combine the 2 errors above it may get very bad.

In short, its the variance of the assumption that hurts you.

However, we face variance whenever we bet, the good cards may not come out.
Yes, variance would be much greater using option 2.

On the other hand, in the example chart, lets say you come back to the shoe with 2 decks remaining, I would approximate that 75% of all shoes are within a few counts (2 or 3 off) of the TC +4 and implied RC + 8 (using option 2).

If you come back relatively soon after you leave (lets say you leave with 1 deck removed, and come back with 2 decks removed), option 2 gets you similar numbers as option 1 anyway, even though the variance in RC is high.

The good about option 2 is if you do come back much later into the game, lets say with only 2 decks remaining, the variance in RC tends to be less as it tends to gravitate around the TC, so it balances out.
 

Gamblor

Well-Known Member
MangoJ said:
As I read the graph the red line is the average RC.

Would you mind making a plot from the same data, but with TC ?
Sure not a problem, give me a couple of days. I actually worked on this because I was stuck at home with car trouble. Have to get back to the casino.
 

iCountNTrack

Well-Known Member
Gamblor said:
Yes, variance would be much greater using option 2.

On the other hand, in the example chart, lets say you come back to the shoe with 2 decks remaining, I would approximate that 75% of all shoes are within a few counts (2 or 3 off) of the TC +4 and implied RC + 8 (using option 2).

If you come back relatively soon after you leave (lets say you leave with 1 deck removed, and come back with 2 decks removed), option 2 gets you similar numbers as option 1 anyway, even though the variance in RC is high.

The good about option 2 is if you do come back much later into the game, lets say with only 2 decks remaining, the variance in RC tends to be less as it tends to gravitate around the TC, so it balances out.
Sorry you cant draw conclusions based on 40 shoes that is statistically insignificant.
 

MangoJ

Well-Known Member
Gamblor said:
Sure not a problem, give me a couple of days. I actually worked on this because I was stuck at home with car trouble. Have to get back to the casino.
Thanks Gamblor. If you still have the data (i.e. as Excel sheet) could you upload them, then I can make the TC conversion.

The reason I'm interested: Your graphs show that RC is tending towards zero linearly. This is expected - every shoe ends with RC=0, because the count is balanced.

The TC theorem states that the average TC is constant. And that is exactly what your graph is showing: A linear decrease in RC towards zero is equivalent to a constant TC, since you need to divide by the number of decks/cards left - which also reaches zero linearly:
In a fraction (the TC), if the numerator (RC) and denominator (cards left) tends towards zero both linearly, the fraction tends to be constant.
 

MangoJ

Well-Known Member
Sorry for Double post. I've catched up with simulation results shown by Gamblor, here are the following results

8deck Game, simple Hi/Lo count. RC = 20 after 1 deck dealt. 100 simulations.

First image (RC.png) shows the RC, red line is the average over 100 runs. You see the linear drop to zero towards the end of the shoe.

Second image (TC.png) is the true count conversion. You pretty easily see that the average TC stays at 20/7 = 2.8 right to the end of the shoe.

I hope that this will end the discussion about the validity of TC theorem, and whether one should return to a game which was abandonded on a +TC count.

In the file TCtheorem.txt I'll give you the MATLAB code (must be renamed to suffix .m) to make further experiments (i.e. other counting systems, deck size, number of runs...)
 

Attachments

psyduck

Well-Known Member
MangoJ said:
Second image (TC.png) is the true count conversion. You pretty easily see that the average TC stays at 20/7 = 2.8 right to the end of the shoe.
What is the correlation coefficient for this linear fit? It must be very low.
 

MangoJ

Well-Known Member
psyduck said:
What is the correlation coefficient for this linear fit? It must be very low.
Its not a fit, it's an average over 100 runs. The stdev of that average is not shown, but can easily estimated by the spread of the individual runs.
If you want a plot for that, no problem.
 

Gamblor

Well-Known Member
MangoJ said:
Sorry for Double post. I've catched up with simulation results shown by Gamblor, here are the following results

8deck Game, simple Hi/Lo count. RC = 20 after 1 deck dealt. 100 simulations.

First image (RC.png) shows the RC, red line is the average over 100 runs. You see the linear drop to zero towards the end of the shoe.

Second image (TC.png) is the true count conversion. You pretty easily see that the average TC stays at 20/7 = 2.8 right to the end of the shoe.

I hope that this will end the discussion about the validity of TC theorem, and whether one should return to a game which was abandonded on a +TC count.

In the file TCtheorem.txt I'll give you the MATLAB code (must be renamed to suffix .m) to make further experiments (i.e. other counting systems, deck size, number of runs...)
Hi Mango, thanks for getting us the TC graph, sorry couldn't get to it right away. Lets just say I'm not Karl Marx, I have to spend more time making capital than thinking about capital :)

Also your 2nd graph can be interpreted as showing why pen is important.

One of your graphs show a +40 RC. If I ever saw that in a real game, think I'd be freaking out :)
 
Top